Thinking about going to a race but you don’t know which one to choose? The Series has so much to offer and so much variety.
Like Superspeedways? They got that. Need that kind of competition packed on a smaller track? There is that too. On the other end of the spectrum are the Short tracks. Not a fan of Ovals? There are plenty of Road courses and a street course to choose from. Tracks out of town or in the middle of a metropolis they are there for your choosing. Old tracks that go back to our beginnings or newly built every season, they have you covered there.
Just want to see Cup-get in and get out. You can do that. Want your weekend full of Cup, Xfinity AND Trucks and maybe another series or two, you can find it here. Like your races with the “normal” level of intensity… whatever that is, you can find it. But if you like your races ratcheted up with a little or a lot of extra pressure, pick a Playoff Race or a Cut Off Race, those are out there as well.
Long or short-there is probably a distance out there to suit you. Concrete or asphalt or city street, dry or wet… there is a surface or surface condition to satisfy your intrigue. Need to see close finishes, we have record breakers for closeness… offset with an occasional “butt-kicking”. Like your races with a little extra, a few more laps of racing than you paid for… you can see that. Can’t tell you where but they’re out there when you least expect it. Racing Mother Nature along with the other competitors, she makes an appearance occasionally, so plan accordingly… it’ll keep you on your toes.
There are just so many factors to consider when making your ticket selections.
Realizing that fans have different tastes and look for different things from a race. Maybe the 2024 NASCAR Stats can help you decide.
Green Flag Passes
Everyone likes passing, don’t they? One car racing past another is what the sport is all about isn’t it? That’s why you go. Using NASCAR Loop Data, we see a breakdown of Green Flag Passes for all the races.
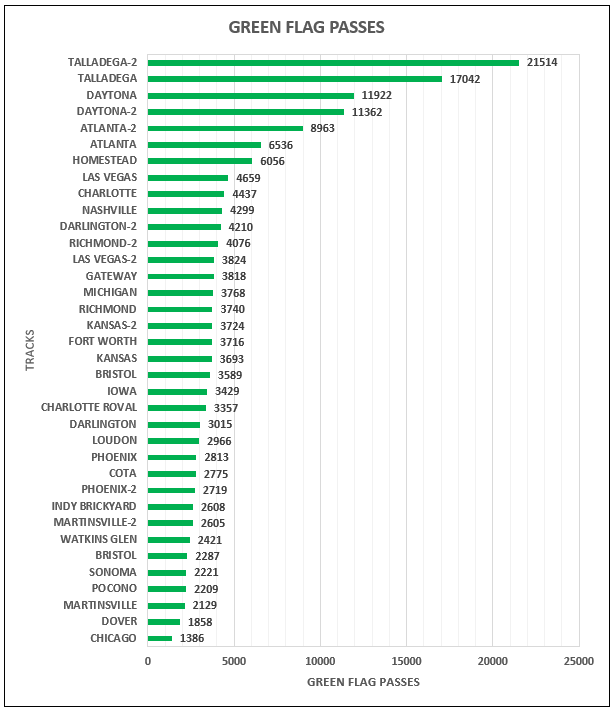
If you like passing, passing anywhere on the track for any position then your “Pack Tracks”-Talladega, Daytona and Atlanta are your best choices. The races there were the Top 6 races when it came to those Green Flag Passes registering between 6500 to 21,000+ Green Flag Passes. Homestead almost crept into this group. From there, it was a drop-off for the remainder of the tracks with Las Vegas leading that group as shown in the Chart above.
But wait a minute. The races are different lengths, different laps. What does it look like when you look at on average how many Green Flag Passes can I expect to see for every Green Flag Lap run?
Green Flag Passes per Green Flag Lap
Here is how the races rank when you take Green Flag Laps into consideration.
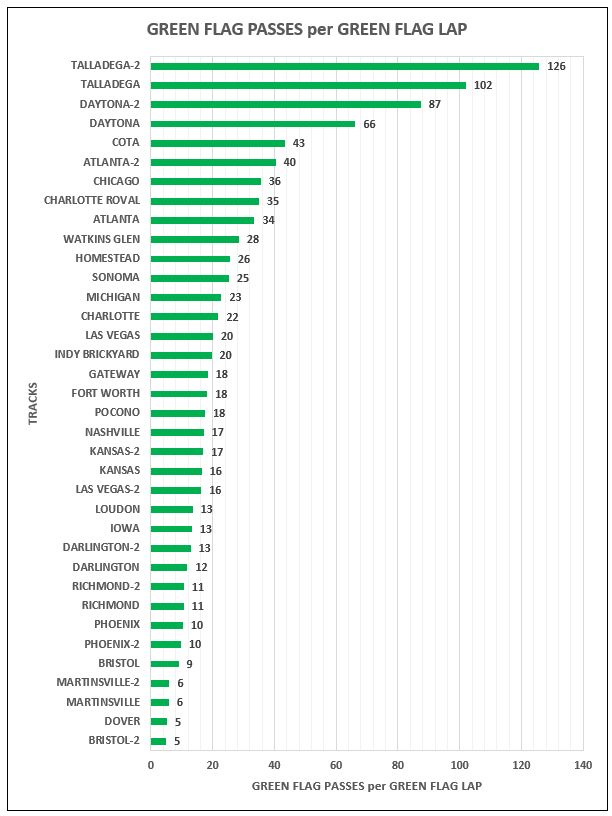
When you look at things that way, making the passing more comparable for the varying race lengths, you can expect the races at Talladega and Daytona to still provide you the most passing action per lap. But Atlanta drops from the mix and Road Courses and Street Course appear as COTA, Chicago Street, the ROVAL, Watkins Glen and Sonoma jump in between the Atlanta Races and make up five of the next eight “Action Tracks”.
With 175,746 Green Flag Passes made at the scoring loops of 8249 Green Flag Laps this season, the average for the season is 21 Green Flag Passes per Green Flag Lap. 14 of the 36 Races exceeded that average, with Michigan and Charlotte finishing out the remaining slots with the races mentioned above.
The remaining 22 races, beginning with Las Vegas’ 20 gradually fall off to Dover and the Bristol Night Race’s tie at 5 Green Flag Passes per Green Flag Lap, which brings up the rear.
At this time, the data says what the fans have been seeing – the big numbers for the “Pack Tracks” are impacted by the “fuel mileage” tactics employed to gain position in the pits rather than on track. Short Tracks, which historically have been the Series “Action Tracks”, aren’t, as they are posting the lower numbers. The Finale at Phoenix is the tied for 6th fewest Green Flag Passes per Green Flag Lap (30 tracks had more passes per lap) while Homestead (previous Finale Track) posted nearly 3 times the rate Phoenix 2 did (26 vs 10). Although there are probably numbers out there to refute this and say otherwise, there is little here that says changing the tire compound from Race 1’s at various tracks to a softer compound at Race 2 resulted in more action as Phoenix, Martinsville and Richmond put up identical or nearly identical numbers.
The deeper you dig, the more you find!
Front or Back? Where did the Passing take place?
One of the common discussions you hear is “There was lots of passing, it was just back in the pack!” That may be true, but how far back? Not all battles are equal and what produces more excitement and drama? Does a spirited fight for P21 get fans on their feet like one for P5 or better? Which one is going to be shown on TV? And if they are showing you the P21 battle you can be almost certain there is none better at the time or the Broadcast Partners would be showing that.
Here is where an additional NASCAR breakdown of the Green Flag Passes comes into play-Quality Passes. A Quality Pass is any Green Flag Pass that took place for P1-P15. If the Green Flag Pass took place for P16 or greater (through end of field) it is NOT a Quality Pass. By comparing the percentage of Quality Passes to the percentage of Quality Positions (P1-P15) we can get an idea where the passing took place.
If you have a higher percentage of Quality Passes than Quality Positions (P1-P15), the passing was distributed toward the front on the field (P15 and above). If the percentage of Quality Passes is lower than the Quality Positions, the bulk of the passing took place mid-pack to back.
The following chart helps you visualize where the Green Flag Passing took place each race-Front or Rear. Any column that extends above the 40% line (Percentage of Quality Positions) had more passing in the front of the field than back (which is more favorable). Columns that don’t reach the line are races where fans saw the bulk of the passing taking place at the rear (less favorable). For those columns not reaching the line, the further the top of the column is from the line, the higher the percentage of Green Flag Passes were at the back of the pack.
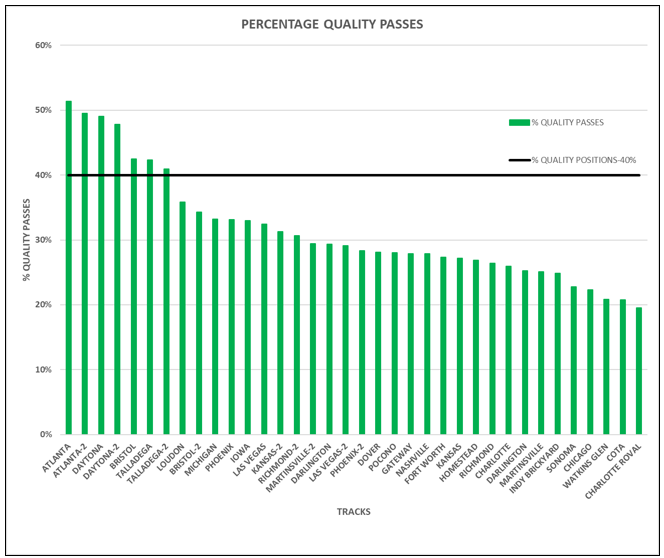
As you can see from this Chart, seven of the 36 races had percentagewise more Green Flag Passes toward the front. As expected, these were the six “Pack Tracks” races, (Atlanta, Daytona and Talladega) along with the Spring Bristol Tire Race that saw major tire wear issues, necessitating varying driving styles and an inordinate number of Green Flag pit stops.
Overall, in over three quarters of the races, the Green Flag Passes are skewed toward the mid to back of the field. If you like to see passing up toward the front, those tracks on the left more closely fit your needs. As you move further to the right, the higher percentage of passing you moves to the back. If that’s what you like, the tracks further right may be just what you are looking for.
So far, a lot of information. Have you found a track that fits your likes so far?
Lead Changes
The pass that gets fans most excited is the Pass for the Lead or Lead Change. In theory, the higher the number the more exciting the racing. Out of the 175,746 Green Flag Passes that took place, 834 or 0.4% of the passes took place for the coveted P1 position. There will be no graph presented on that as that slice of the pie is so small that Lead Changes wouldn’t be visible.
So which Tracks have the most Lead Changes?
Here you go!
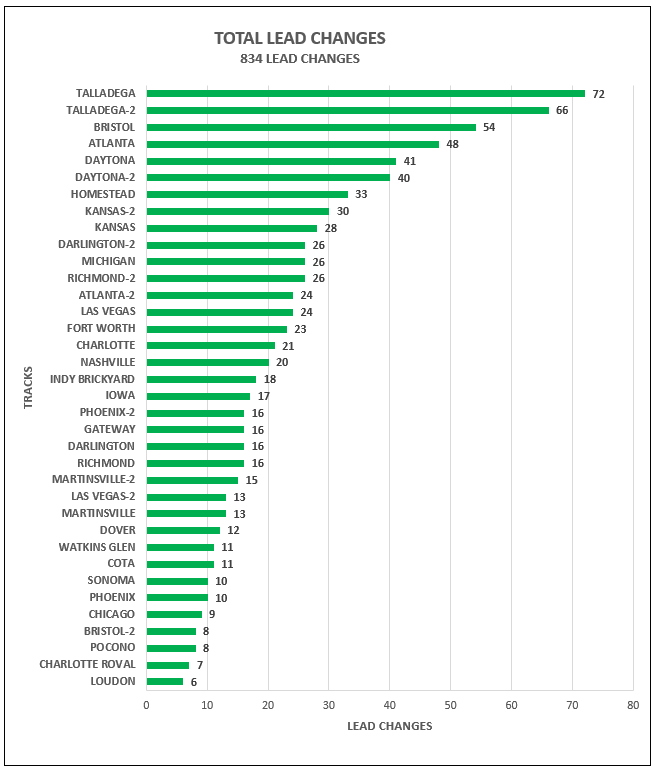
On the surface, if you are into just overall Passing for the Lead, in 2024, your best bets are the “Pack Tracks”, Spring Bristol, Homestead and the Kansas races.
But are All Lead Changes the Same?
When fans hear the broadcasters gushing over the race stats and talk about the number of Lead Changes in a race, thoughts go immediately to how many times Car P2 raced around or overtook Car P1 to take the Lead. Next to any unfortunate on-track mishap occurring, nothing gets fans to their feet quicker than the Lead Change. But if you’ve been around racing for a while, you know that Lead Changes can occur under Green Flag conditions (exciting) or Caution Flag conditions (not so much). But you’ll never hear any of the Talking Heads mention any difference, they’ll just let you think that all those Lead Changes brought fans to their feet.
Let’s take a proverbial “Deeper Dive” and see just how many of those Lead Changes are those Green Flag Lead Changes everyone wants to see. Just how do those Lead Changes break down?
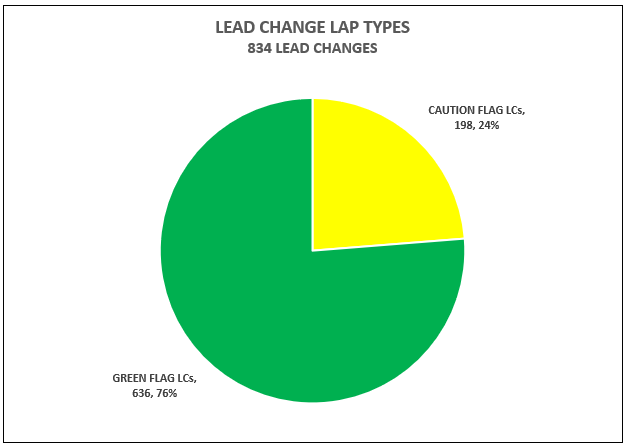
When you compare the Green Flag Lead Changes to Caution Flag Lead Changes we see that just under 24% of the Lead Changes happened under Caution Flag Conditions. So, when your favorite Talking Head throws that Lead Change stat out, remember that nearly 1 out of 4 Lead Changes they mention aren’t what you think they are.
A further breakdown the Lead Changes down for each track, you get the following…
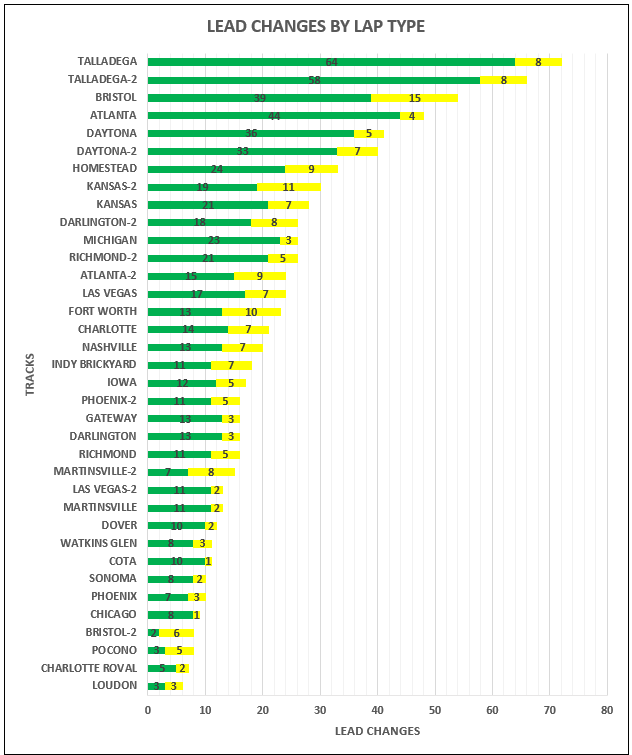
A quick look here shows for instance that Bristol’s Lead Change numbers places it right up there, making it the highest ranking Non-“Pack Track” for Lead Changes. But having the highest number of Caution Flag Lead Changes of any track on the circuit helps inflate that number. Kansas-2, Darlington-2 and Atlanta-2 also benefitted from the Caution Flag Lead Changes. If CFLC’s don’t bother you, the chart above may help you decide which track you want to go see races at.
If you prefer seeing Lead Changes on-track under Green Flag conditions, you might want to use this one instead.
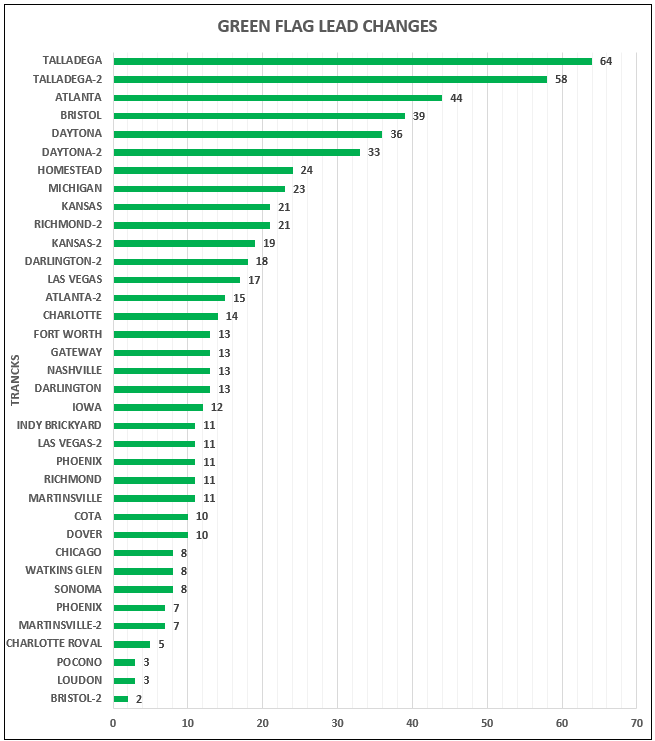
As mentioned earlier, this chart removes the “bump up” provided by Caution Flag Lead Changes and leaves you with the Lead Changes that excites fans. Noticeable items were the “drop off” at Atlanta-2, which was more than half of the first race there. As a “Pack Track” you would expect it at the top of the chart with the other “Pack Tracks” not buried with the other tracks. Did putting it in the Playoffs adversely affect the racing there? Were drivers racing as hard or running not to lose and screw up their Playoff chances? Maybe timing is something you should consider when planning to attend.
Also, the Spring Tire Debacle and Fall Kyle Larson’s “Bristol Butt Kicking” really stands out. The Spring race had almost 20 times the number of Lead Changes as the Fall race. Other two date tracks showed swings, but none had swings as massive. That was reflected in the fan criticism afterwards, which was as massive. Race winner Kyle Larson even took to Twitter for a lengthy post explaining things and closed by reminding fans to-
“Butt-kickings” happen and usually there is no way to predict them. But so long as you temper your expectations, you should be all right.
How often should we expect a Green Flag Lead Change?
As mentioned before because races vary in the number of laps that make them up, the opportunity for Lead Changes vary as well. So how many laps have to be run before fans can expect to see some type of Green Flag Lead Change? Obviously, the fewer the laps between Lead Changes, the more action up front and more exciting the race (maybe?).
This chart gives you an average number of Green Flag laps before there is a Position Change at the front of the field.
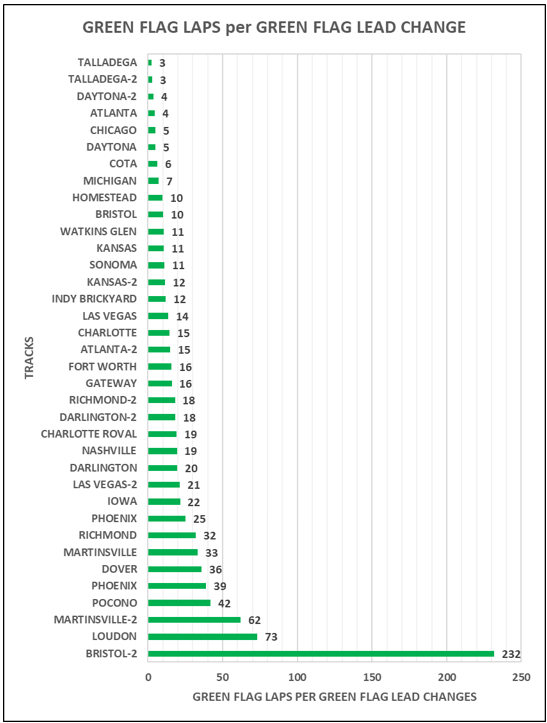
As expected, if you want to see action up front, it’s the “Pack Tracks” that will come closer to satisfying your needs. Surprisingly though, the Road Courses are right up there with Chicago and COTA running with the Green Flag Lead Change big dogs. Michigan’s 7 lap average was the only other track to have something happen up front in single digit laps. This may explain the renewed fan interest there.
Watkins Glen and Sonoma came in with an average of 11 laps, placing it up there with Homestead, Tire Deal Bristol and Kansas as the top races with double digit laps before a Green Flag Lead Change.
The Phoenix Finale race saw a 25 Green Flag Lap up front average, which again placed it significantly behind Homestead’s 10.
Again, if you like Blow Outs, Kyle Busch’s performance at Bristol really stands out here. If he had just qualified about 0.08 seconds faster that graph would have looked even worse!
Temper those Expections…
But are all Green Flag Lead Changes the same?
As mentioned earlier, when fans hear Lead Changes, they immediately think of Car B racing past Car A to take P1 and hold it to the line. But is that really the case even when we talk about Green Flag Lead Changes?
What about when cars are on differing Pit Strategies and the Leader gives up the Lead to pull into the pits? That’s a Lead Change. How about if the Leader wrecks and gives up the Lead? Or Car B passes Car A while they are bunched up on a Start or a Restart? Is that the same Lead Change as an exchange that happens without benefit of the Restart Bunching or the Leader just pulling off to pit and gives the Lead up? There are basically four types of Green Flag Lead Changes. Here is a breakdown of the frequency they occurred in the 36 races in 2024
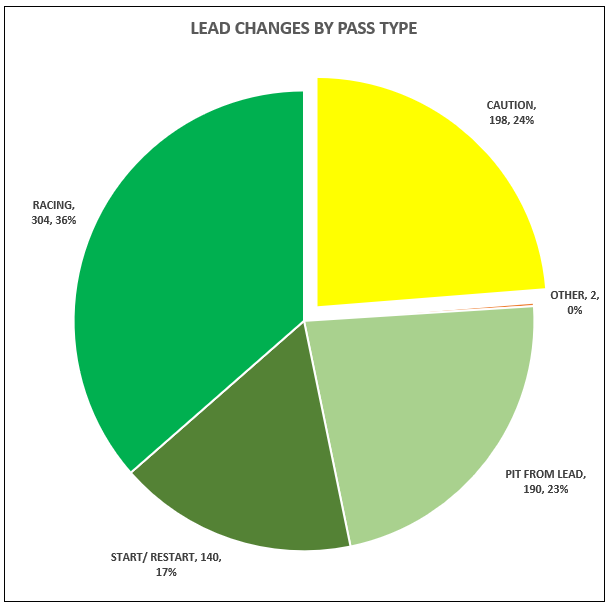
As you can see, the four categories of Green Flag Lead Changes make up 76% of the Lead Changes that occurred. Let’s take a look a deeper dive into those types to see if any of the races produce the type of action of front that would entice you to buy a ticket to it.
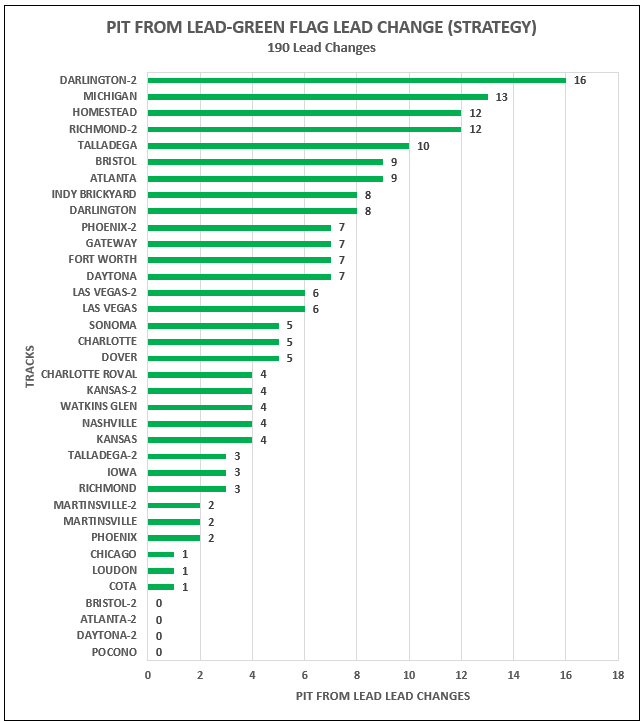
Does Strategy Passes get your Race Fan motor running?
If seeing cars exchange the lead because they are on different Pit Strategies or are racing differently to save fuel or tires pass because they are on a different pit cycle, then this chart may help you decide where you want to go.
What about Real Green Flag Lead Changes? I want to see Real Green Flag Lead Changes not someone pull off the track and give the Lead up!
Here you go! Here are the Green Flag Lead Changes where Car B passed Car A to take over P1. These passes can occur during Starts or Restarts or during racing outside the Green Flag Pit Cycles.
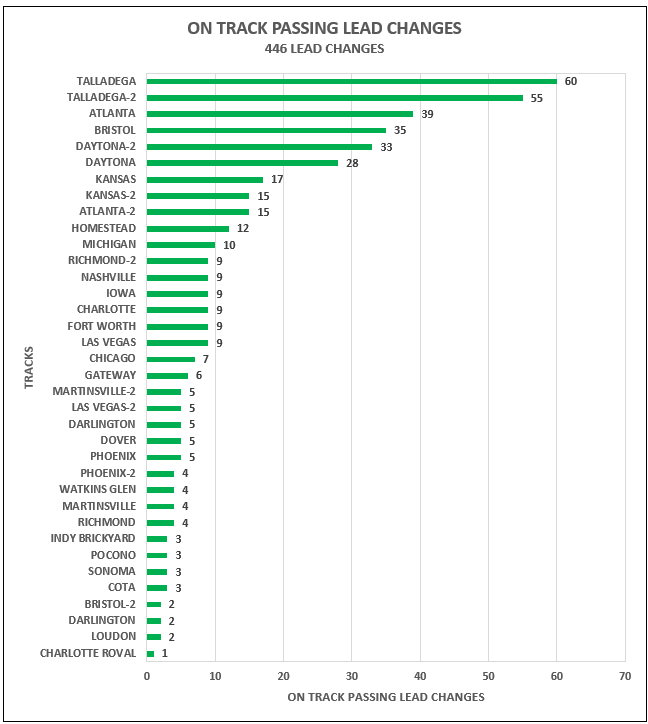
Once again, you see the “Pack Tracks” take the Top Spots with the Bristol Tire Deal thrown in the mix. Also, the Atlanta Playoff race had a noticeable drop in these Lead Changes (35 vs 15) from Race 1 to Race 2 there. Did opening of the Playoffs impact the way the drivers raced? If it is, it shouldn’t be a factor this year since Atlanta 2 is moving out of the Playoffs… but you might want to consider that for the new additions.
Martinsville was similar with the Playoff race producing almost half the Lead Changes that the Regular Season produced-and considering the Spring race is 100 laps shorter, that’s something to think about. Kansas didn’t seem to be impacted by placement, it’s a consistent top performer amongst the Non-“Pack Tracks”. Bristol… we’re not even going to talk about between the “Tire Deal” and the “Butt-Kicking” there is nothing to compare. About the only thing you can say is you don’t know what to expect there at either race.
Former Championship Finale, Homestead, was near the top of the Non-“Pack Tracks”, producing three times the Lead Changes this year’s Phoenix race produced.
That’s great, but how does the race variability factor in? Races aren’t the same length you know!
Fans saw 446 Green Flag Passing Lead Change over 8249 Green Flag Laps or a Green Flag Lead Change on average about every 18 Green Flag Laps. Here is that breakdown by race.
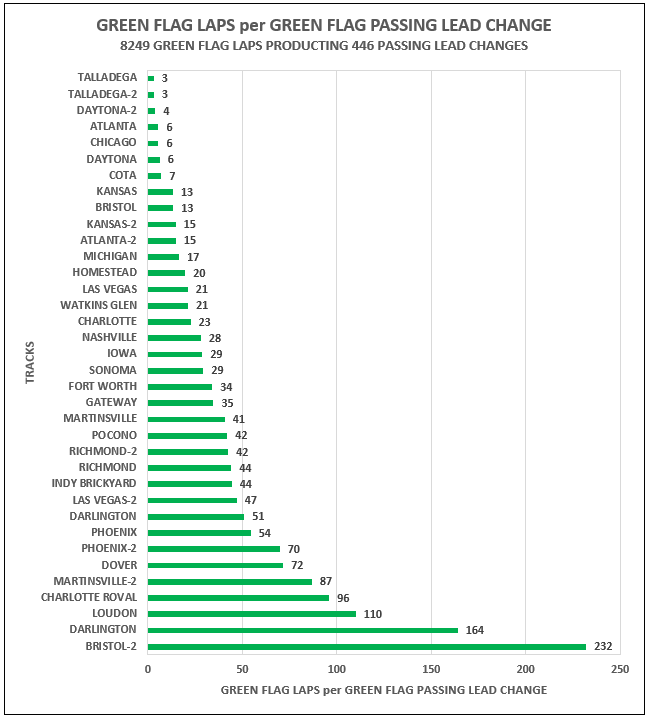
If you stand every time there is this type of Pass for the Lead, you’re going to be standing a lot at the “Pack Tracks”. This in part to how we’ve classified the Tracks, the cars run in Packsand tend to run side by side. Factors like Fuel Mileage, the aero characteristics of the cars increasing the difficulty to complete a pass, inability to create runs to the lead, these have become “momentum races” and may take several “back and forths” exchanges before a pass can be fully completed. We have what we have, and this produces the averages we see here. Again, the Playoff Atlanta faltered a bit compared to the other “Pack Tracks” and COTA was a surprise for the Non-“Pack Tracks” as fans there got to see a pass for the lead in single digit laps.
Kansas was the next highest coming in at P2 and P4 for the NPTs. The Bristol Tire Deal snuck in at P3. Michigan fans saw a Passing Lead Change on average every 17 laps followed by Homestead with every 20 Green Flag Laps, over three times more frequent than this years Finale at Phoenix (70 vs 20). Bristol 2’s 232 average further defines a “Butt-Kicking” considering the actual numbers were even worse. Now whether we get that again… who knows.
Speaking of Phoenix, how about those wild restarts? Don’t they count for something?
Starts and Restarts are an interesting phenomenon in that for a few laps following the drop of the green flag the field is bunched together and gives drivers their best on-track opportunity to improve their position. That’s why we see the aggression level and risk-taking rise along with the resultant Cautions when things don’t go as planned. Let’s first look at which tracks had the most Restarts.
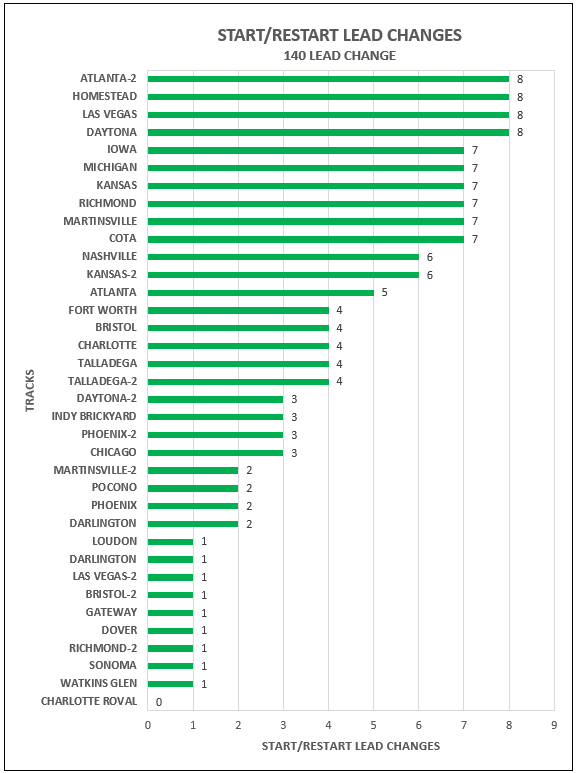
That’s interesting but it doesn’t mean much unless you know how many Restarts each race had to see how frequently Lead Changes occurred on Restarts. The more Restarts, should mean more Restart Lead Changes shouldn’t it?
Let’s first look at how many Restarts must occur before fans see a Lead Change occur during those key periods.
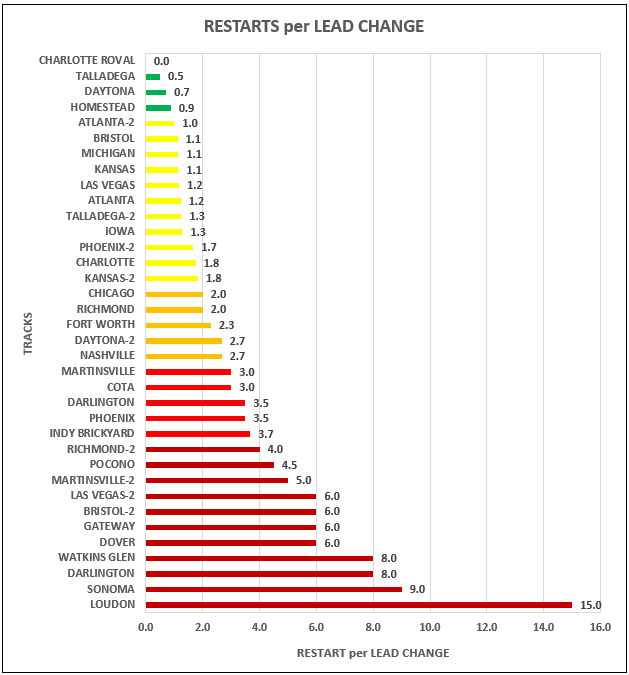
From the Chart, fans at the Green Tracks saw more than one Lead Change per Restart. How is that possible you ask? At these races, they had restarts that had more than one Lead Change in the three-lap period in the Restart.
Yellow Tracks had about 1 Lead Change per Restart. You saw a Lead Change every other Restart on the Orange Tracks, while the Red ones saw on every Three Restarts. The rest took four or more with the worst one, Loudon, seeing 1 Lead Change in 15 Restarts. If you are going to the ROVAL to see Lead Changes on Restarts-forget it. Didn’t have any this race.
Phoenix, which is known for it’s crazy, five wide restarts, may be crazy throughout the field, but is a fairly calm up front, producing a Lead Change every Restart and a half, up to three and a half. That means that all the fanning out is more show than go. But it sure looks good.
But what about Racing Lead Changes, the Real Lead Changes we think of when we hear Lead Changes?
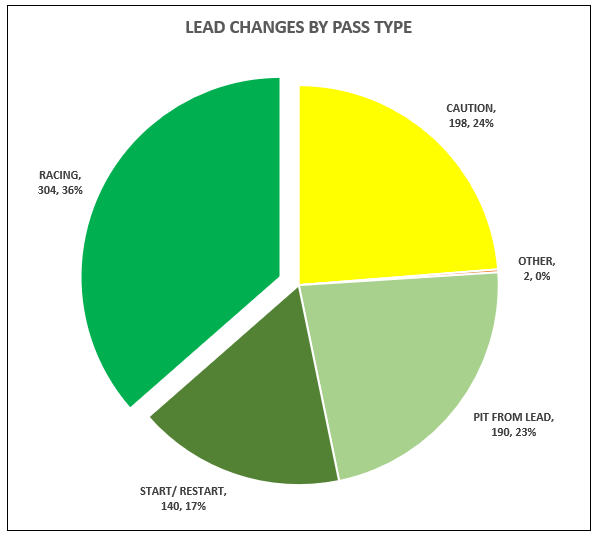
Those Green Flag Passes that occur between Restarts and Leaders Pitting From Lead, where Car B races past Car A to take the Lead, those Lead Changes that get the fans in the stand on their feet, made up 36% of the Lead Changes for 2024.
And here is the breakdown by race.
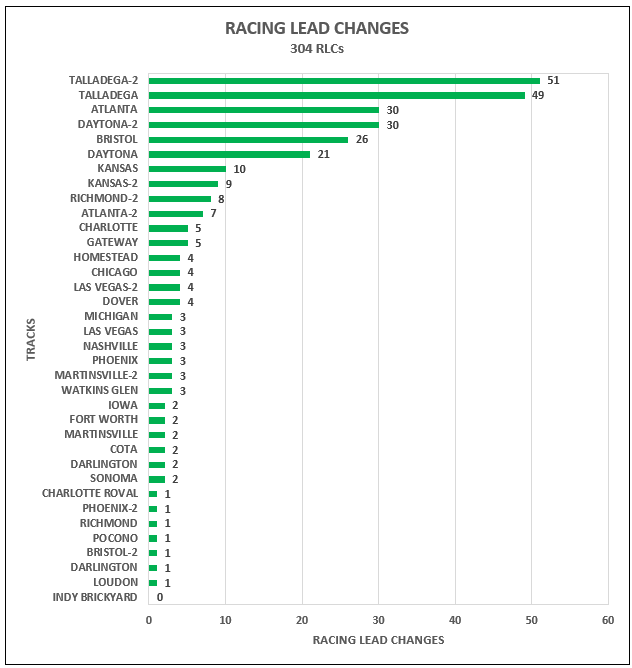
Again, it’s the “Pack Tracks” who top the list, with the Spring Bristol Tire Race sneaking into the mix. Playoff Atlanta dropped back into the pack, Kansas showed well for both racesand the tire changes at Playoff Richmond produced significantly more action up from (8 vs 1) than the Spring setup. The Chicago Street Race was the leader of the Road/Street Races and Homestead produced more Racing Lead Changes than the Phoenix Finale (4 vs 1). Fourteen of the races had 2 or less Racing Lead Changes with six races having only one Racing Lead Change. The move back to Indy Oval for the Brickyard produced a disappointing goose egg for Racing Lead Changes.
How many laps do I have to wait to see someone pass or overtake the Leader for a Lead Change?
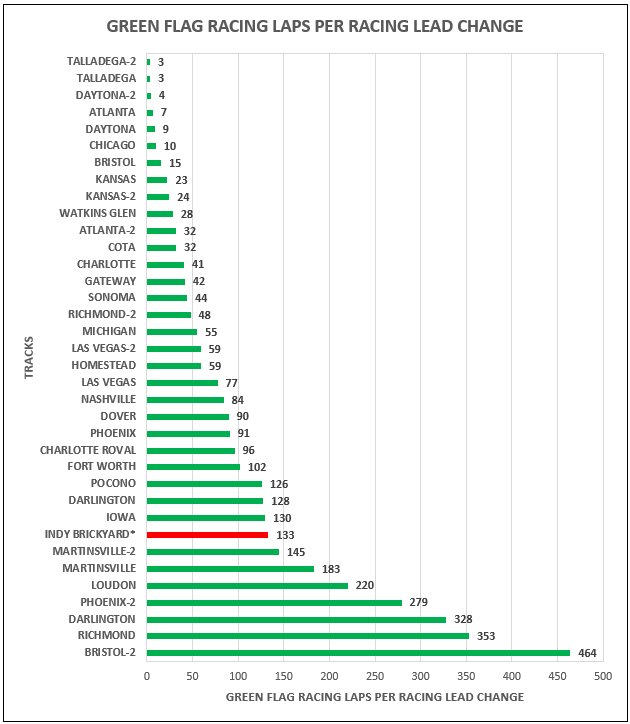
At Talladega you won’t have time to sit down before you are standing up again for another Lead Change as they occur there about once every three Green Flag Laps. As mentioned before that’s a product of “Pack Track” racing. Same at Playoff Daytona. Regular Season Atlanta and Daytona are close behind, followed by Chicago, where you have a Racing Lead Change about every 10 Green Flag Racing Lap.
When you get to Playoff Atlanta and beyond, you’ll be sitting a while before you jump up to watch a Racing Lead Change. Indy had none for the entire race. Spring Richmond… it’s now in Mexico City. Playoff Bristol… well, it’s gonna take a lot of laps… good thing they don’t take long to complete.
How about those finishes? Which races had the closest finishes?
That’s the bottom line isn’t it. All that racing to get to a great finish? Here is a breakdown of the closest finishes of the season.
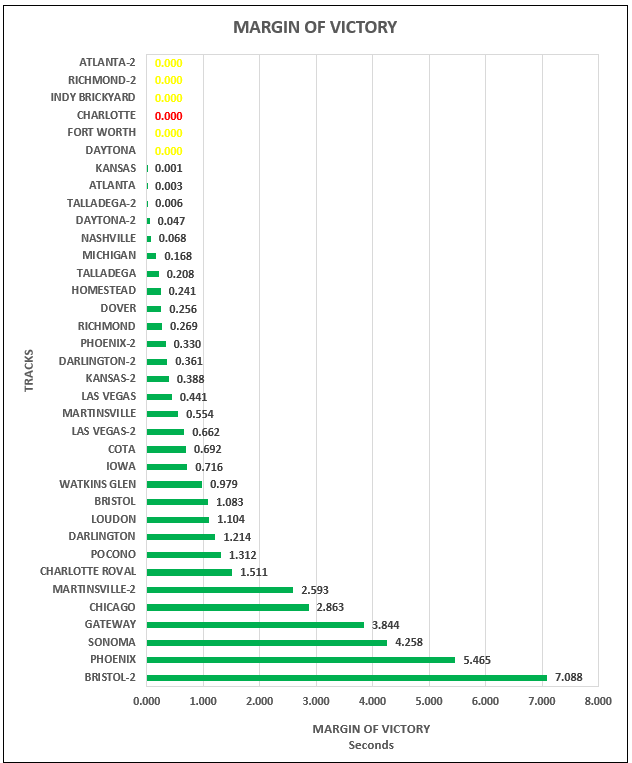
Six of the 36 races this season had no Margin of Victory because they either finished under caution or were red-flagged due to weather. We saw record breaking finishes at Kansas and Atlanta and Talladega’s 0.006 second MOV was nothing to sneeze at. Daytona-2 and Nashville had finishes less than a 0.100 secondsand Michigan had a closer finish that Spring Talladega, the “Pack Track” with the largest MOV (0.168 vs 0.208). Overall, 19 of the 30 races that had MOVs had finishes under 1.000 seconds.
On the other end of the spectrum, 4 of the 30 races with MOVs had finishes greater than 3.000 seconds, with Larson Bristol “Butt-Kicking” leading the way at 7.088 seconds. Spring Phoenix was next at 5.465 seconds with Sonoma and Gateway rounding out that field.
If you’re into close finishes (who isn’t?) chances are fairly goodthat if you go to a race that does in fact finish under green, you’ll see a close finish.
Whew! That’s a lot of info.
Hopefully, the information hasn’t been overwhelming but provides different angles to consider in your ticket-buying decision making. Just remember that each track has its own characteristics and its own style of racing. What you see can vary and can be dependent on a variety of factors such as the tire or tires that are being used, to where it is on the schedule-Regular Season Races vs Playoff Races.
But it’s just info. Something to consider. Hopefully, it will give you a better appreciation of how the season unfolds as the circuit makes it’s way through this new schedule.
The main thing is to choose wisely and go. Have fun. Take in the racing. Meet new friends and create new memories.
This info though can help you on the races you don’t choose to go to. Just remember, when you tune in, the broadcast partners are going to be showing you many of the things listed above. They will show you the starts and restarts and hopefully show a few laps after to catch the action that may happen because they are bunched up. They’ll show you Racing Lead Changes (although FOX is notorious for their signature “Half Pass”, showing the last half of the pass, not the set up or the beginning) no matter how frequent or infrequent they may occur. The charts can help you have some idea how glued you need to be to your set. And those “Strategy Races”, Larry Mac or Steve Letarte will have you on the edge of your seat as they explain their finer points and subtleties of calls from the pit box. Regular passes-all depends on what’s happening up a head, but if the passing is back-loaded you can bet the battles up front may be memorable, but infrequent.
The main thing is, no matter what your taste or preferences, you need to tune in and see how the season goes down.
With that, Happy 2025! Won’t be long until Cup returns to Bowman Gray and we get this party started! Till then…
Thunder On… and Stay Safe
David Nance
Photo Credit (cover): Daniel Suarez, #99, crosses the finish line ahead of Kyle Busch, #8 and Ryan Blaney#12, to win the NASCAR Cup Series Ambetter Health 400 at Atlanta Motor Speedway on February 25, 2024 in Hampton, Georgia. (Photo by Alex Slitz/Getty Images)


